Healthcare / Biotechnology ~ $COMPX
SectorRS = ++(rs:-85) SVNT+5.2% EXEL+5.2% REGN+4.0% CLDA+3.7% XNPT+3.3% PDLI+3.0%
REGN [Q] | Stock = Regeneron Pharmaceuticals, Inc.
Healthcare / Biotechnology ~ $COMPX SectorRS = ++(rs:-85) SVNT+5.2% EXEL+5.2% REGN+4.0% CLDA+3.7% XNPT+3.3% PDLI+3.0% |
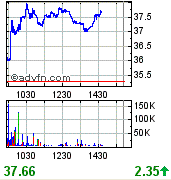
| REGN (2/14, 14:45:02, 37.65-66): PAT2; 3mRunaway+:5 [+6%,.9%offHi], News, PrvCLo-, PDayTBnd+, 27:3Accel+; TLM:43, StrongPrvClGap+, 1YrHi+, AvgDyV/R=791.91T[x2.6]/1.38[x1.5] (PotLONG); vl:5; rs:+73 |
| 3mRunaway+:5 | [Runaway] Assets making large % moves on the day (up/dn), that appear to be steadily trending and may be ready to continue those moves higher or lower on that timeframe (ie. 3m / 1m). Also shows number of times the Runaway alert has triggered on the asset (ie. 1mRunaway+:3 – ":3" = 3rd time alert triggered) |
| News | [News] News headlines released for asset |
| PrvCLo- | [PrvCLo] Previous Day’s Range was Greater than average and the Previous Day’s Close was no more than a 25% retracement (from high-low) off that day’s low. If the alert designates "PrvCLo-", a very weak previous day close is indicated (maximum 10% retracement off low from high-low). |
| PDayTBnd+ | [PDayTBnd+] This alert shows up the day after a tymoraPRO Upper Trading Band on the Daily timeframe was breached. This can be used to find alerts today that may indicate the current day to be a reversal day based on the previous day’s extreme trading activity (ie. if PDayTBnd+ shows up on a GapUP alert today). |
| 27:3Accel+ | [Accel+] Shows number of timeframes that are outside their upper Acceleration Bands (similar to Bollinger Bands, visit http://www.bigtrends.com/blog/Indicator-Alert-Acceleration-Bands.html to learn more). ie. "8:2Accel+" indicates that price is trading above the upper Acceleration Band on two timeframes (including the 1 minute), and the last 8 bars on the 1 minute chart have been trading above the upper acceleration band. |
| TLM:43 | [TLM:] Modifier showing the total executed trades that occurred in the last minute (TLM = TradesLastMinute) |
| StrongPrvClGap+ | [Gap+] Alert modifier indicates asset had an upward gap that day – it also shows you how much higher or lower the asset’s currently trading versus where it opened, as a % of the gap move. So if you see "Gap+:+10%chg", and the asset gapped up 1 point, we are currently trading at 0.10 above the gap. This makes it easy to screen for certain gap scenarios and to see how the gaps are holding. "PrvCGap+/-" is the same, except the gap is being measured from the Previous Day’s Close instead of the Previous Day’s High or Low. "fill" indicates the percentage of the time gaps in this stock tend to fill or close the next trading day. Be aware, of course, that the wider the gap, the less likely the asset may be to "close the gap" (ie. watch out for runaway gaps, especially in stocks with potentially "game-changing" news). If "Strong" is indicated, there has so far been little or no retracement since the Gap opening. [PrvCl] Previous Day's closing price |
| 1YrHi+ | [1YrHi] Traded above (+), or back below (-) 1 year (52 week) high |
| AvgDyV/R=791.91T[x2.6]/1.38[x1.5] | [AvgDyV/R] Average Day's Volume / Range versus normal - For example, "10M[x3.0]/0.50[x2.0]" means 10M shares traded on average (and currently 3x normal volume), over $0.50 daily average price range (and currently 2x normal price range). |
| (PotLONG) | [PotLONG] Potential LONG opportunity setting up |
| vl:5 | [vl:] "Volume Level" modifier, which adds a "tier" to stock alerts for the advantage of easy advanced screening of stocks by minimum average daily levels of trading volume. "vl:9" - 10M shares or more average volume per day "vl:8" - 5M shares or more average volume per day "vl:7" - 2M shares or more average volume per day "vl:6" - 1M shares or more average volume per day "vl:5" - 750T shares or more average volume per day "vl:4" - 500T shares or more average volume per day "vl:3" - 250T shares or more average volume per day "vl:2" - 100T shares or more average volume per day "vl:1" - 50T shares or more average volume per day "vl:0" - less than 50,000 shares average volume per day. So, if you add "15-50 vl:6 vl:7 vl:8 vl:9 +HUGE +TRDV" to your MainFilter, you’ll get stocks priced from 15 to 50, with average volume from 1M+ per day (vl:6 vl:7 vl:8 vl:9), and only for alerts that include the terms "+HUGE" ("HugeRngBars", "Huge%Moves") and "+TRDV" (only those that occur on heavier than average volume, ie "3x:2xTrdVol"). |
| rs:+73 | [rs:+] Relative Strength Rank of asset ("+" = relative strength rank increasing, "-" ranking for asset is decreasing) versus all other stocks in tymoraPRO (on a scale of 1 to 99) |