The upper Chart is known as the Level Chart, as it breaks down the asset’s movement using a proprietary algorithm based on a LevelSize determined by tymoraPRO. The LevelSize used can be compared to an automatic optimization of the ideal “box size” on a point and figure (P&F) or Renko chart on a tick-by-tick level. The goal in creating the Level Charts was to combine the best features of P&F, Renko, and Rangebar charts, while still considering other statistically significant details those charts may discard or minimize, as may appear through volume or time. The final result is best described as a sort of tick chart that removes much of the random “noise”, factors in time and volume, and acts as a cross between a point and figure chart and a real-time non-lagging moving average of an asset’s trading activity. These LevelCharts also consider the up/down volume required to move the asset to the next price level and will also indicate where the key volume battles appear to be taking place. Combined, these features are especially powerful because they seek to isolate the true market’s movement and provide a much clearer view of the underlying trend. The lower Chart is known as the ChartTrend Chart, and can quickly switch from a 1 minute, 3 minute, 5 minute, 15 minute, 30 minute, 60 minute, or Daily view. You can especially notice the difference between LevelCharts and more standard timeframe charts on fast moving markets, where the LevelCharts make it much easier to identify multiple symmetrical wave patterns and formations.
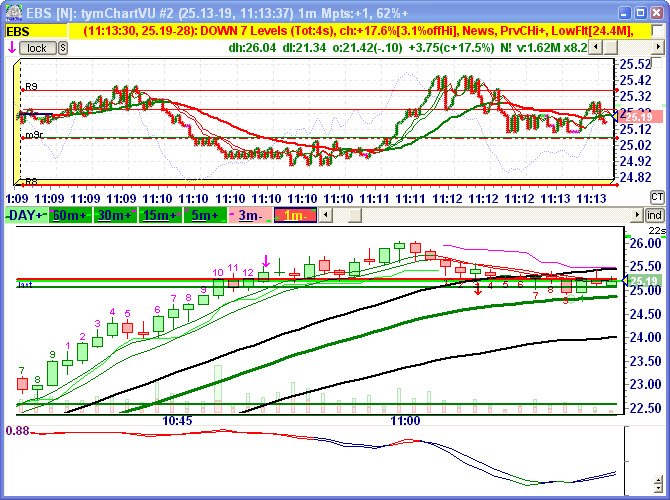
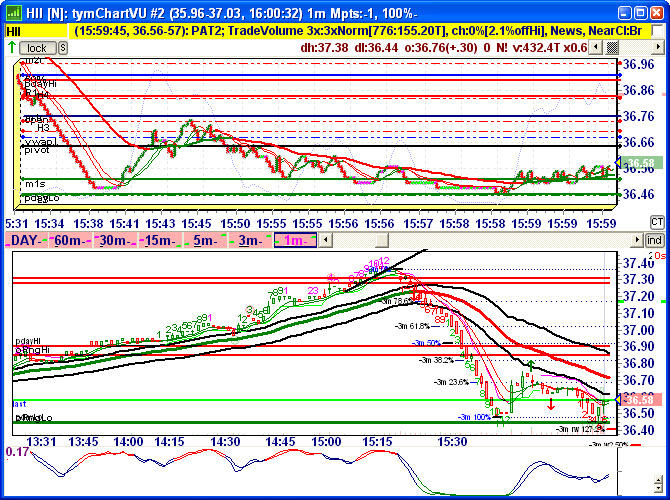
tymoraPRO LevelChart versus 1 minute Chart – notice how much clearer you can see the bases, spikes, and the underlying wave structure especially in faster moving markets.
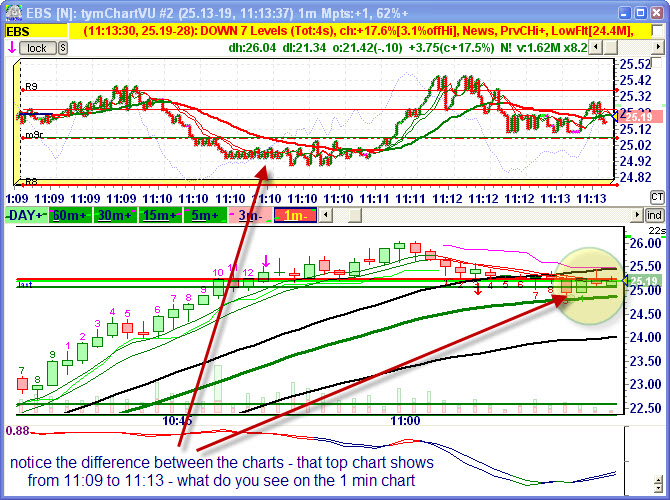
With tymoraPRO, you can easily see bases forming that don’t even appear on a 1 minute chart.
tymoraPRO is the ultimate Tape Reading Tool, enabling you to quickly and easily key into the underlying market structure and tune into the current flow of the market.
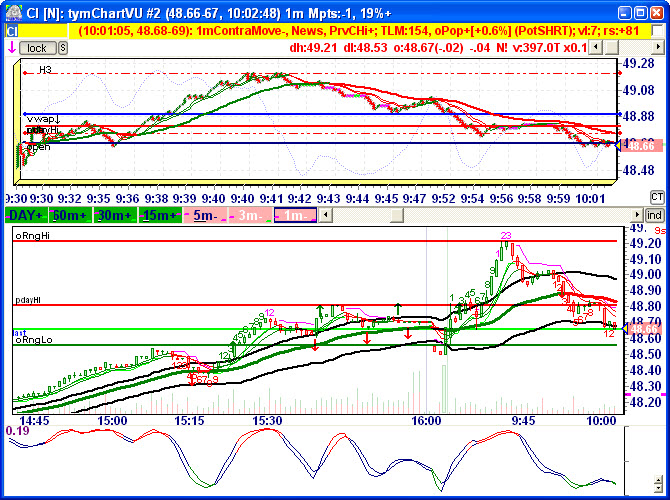
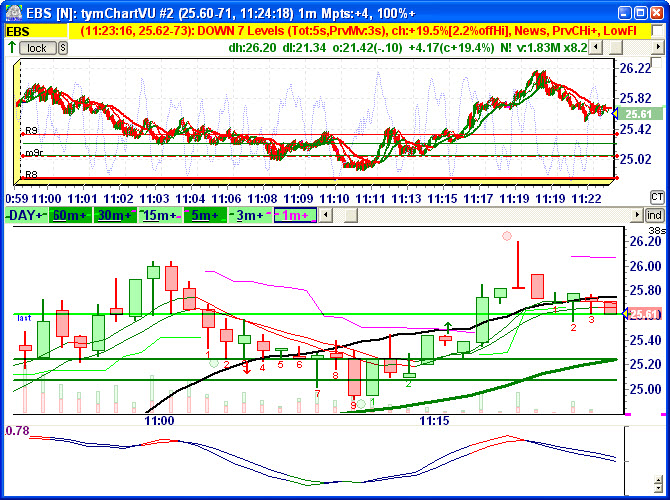
Clearly and easily identify multiple areas of consolidation for both long entries and then short entries after the reversal. Can you find all those bases on the 1 minute chart?
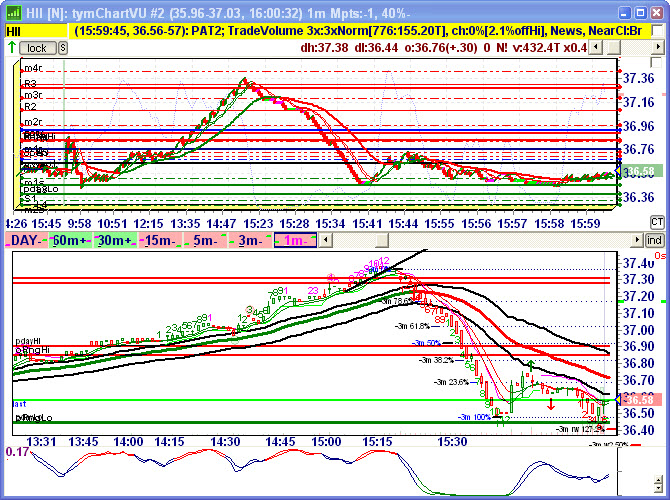
Notice how well the LevelChart encompassed the upmove and its pullbacks, as well as the downmove and its slight retracements as well. Also notice all the volume turnover that appears near the lows on the LevelChart (barely visible on the 1min chart).
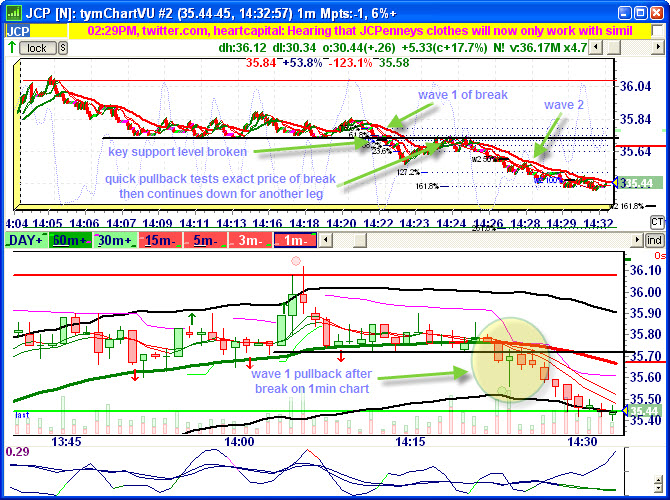
Notice how much clear the two down waves are on the LevelChart versus even the 1 minute chart after price in JCP broke below the 35.72 level, providing a clear potential short entry into the prior broken support level (which would now be considered resistance).
Muddy Waters Research targets
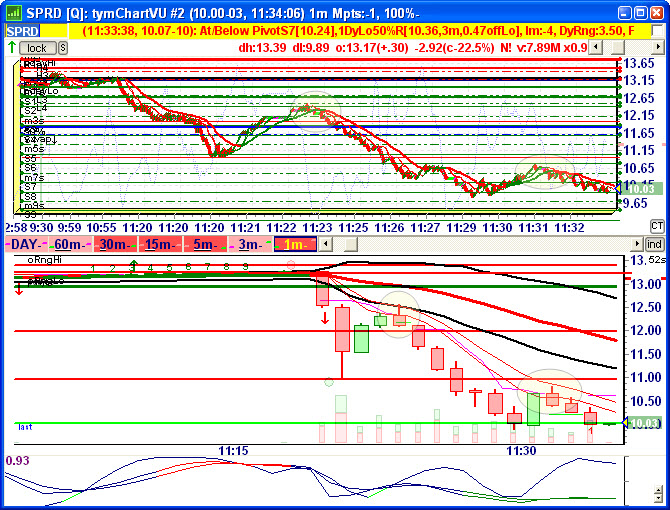
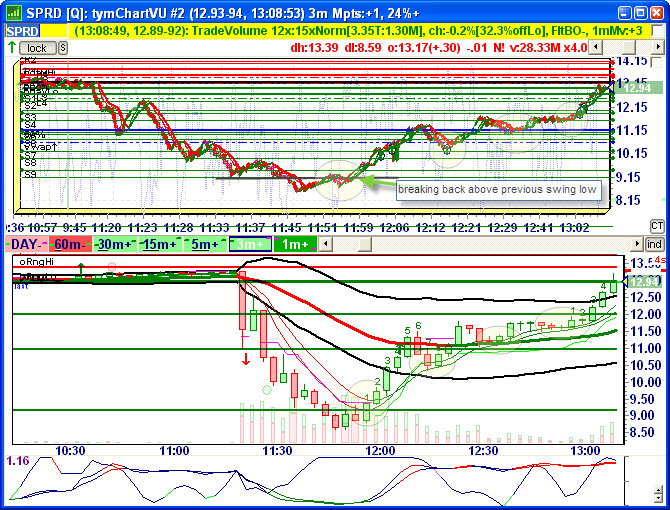
SPRD. See how clearly we can see the price movement on the level chart. As price tests the inner band of the downward trend Moving Averages on the 1m, we can watch the Level Chart for potential short entries. If the stock finds support back above the outer moving average band, we can use that as a potential tight stop loss (ie. closing and holding above it on the 1min chart). As the stock slows down, traders can watch the 3m or 5m chart for a similar pattern.
 Note:
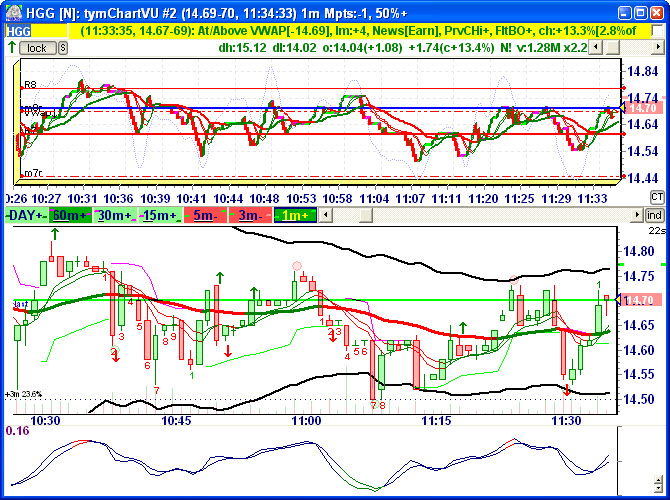
Note: As an FYI, the indicators enabled on the LevelCharts shown include Trends and StochCCI, as well as Pivot Points and other key levels. The 1min charts are showing SMI (Stochastic Momentum Index), Acceleration Bands, and 34-8-5 EMAs (Exponential Moving Averages). You may also see Chandelier Stops and a Demark-style sequential indicator as well. The arrows basically indicate an 8-5 EMA cross (which can sometimes be used as a contrary indicator on the 1min chart if a quick reversal occurs right after). Some charts also show multi-timeframe retracements as well, as well as the time remaining on the current bar and the average bar ATR (Average True Range).